

Have you seen those compelling financial TV commercials advertising investments from companies like Fidelity, Charles Schwab, Merrill Lynch, Ameriprise, Edward Jones, and Raymond James, etc.?
They talk about the road to retirement and how easy it will be if you only invest with them. They talk about all the glory of what they can do for you. These financial institutions base their assumptions off of you earning an “average” rate of return.
We hear often in the financial planning world about an “average” rate of return. I want to show you what that really means.
If you have a portfolio of $1,000,000, let’s make an assumption that in one year, you earn a 100% rate of return growing your $1,000,000 to $2,000,000. It looks great, but what happens if in the second year you lose 50%. You are back down to the same $1,000,000 you started with.
However, in year three, you have another great year and earn another 100% return. You are back to $2,000,000. But, unfortunately in year four your portfolio drops again, you lose 50% and you are once again back down to $1,000,000.
Here’s what that looks like:

So, what has happened and what does this really mean?
At the end of this four year time frame, you have the same $1,000,000 that you started with. Financial advisers and Wall Street will tell you that you had an “average” rate of return of 25%. They would say, “Look, you are a phenomenal investor! Great Job! You just averaged a 25% rate of return in your portfolio.”
Yet, your’re looking at your portfolio balance and saying, “Wait, I have the exact same $1,000,000 that I started with four years earlier.”
Your “actual” rate of return is zero.
Shown here, you see the “Average Return” is 25%, but the “Actual Return” is 0%.

This is the fuzzy math that gets used in the world of Wall Street and financial advising. They use this type of math to convince investors to invest with them.
And frankly, the math doesn’t add up.
Now, you might think that my example here is being exaggerated. Who earns a 100% return, then loses 50%, back to 100%, then loses 50% again? Who does that?
Well, take a look at this…

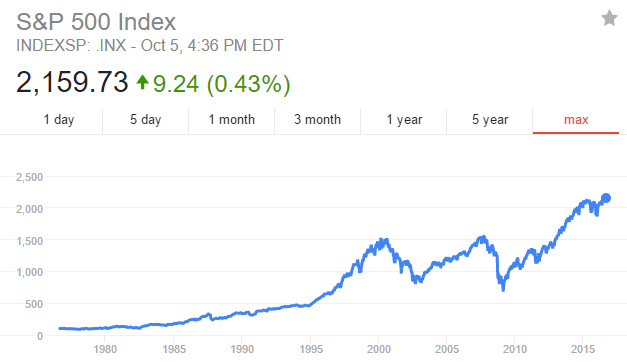
This is a chart of the S&P 500, an extremely popular and well know index in the financial world.
In 1997, and over the next three years, there was an aggressive increase of 106% in the growth of the S&P 500. Then at the peak in March of 2000, the S&P began to drop dramatically. Over the course of the next three years it lost 49%. Then in October of 2002 it began to climb again through October 2007; a 101% return.
Then as we all know, in 2008, the crash began. The S&P 500 lost 57%, bottoming out in March of 2009, below its value twelve years earlier in 1997.
In other words, your S&P 500 portfolio would be worth less in 2009 then it was in 1997.
Look at the trajectory the S&P 500 is showing now. According to the chart above, it has climbed and risen to a staggering 184% growth rate since 2009. Today, the S&P 500 is over 2,100, that’s an astounding 210% growth rate since 2009.
The markets have reached all time highs.
What does the future hold? Let’s take a quick look at the pressure that is on the US economy.
The US is over 19 trillion dollars in debt. Social Security has nearly more going out than coming in. The pressure of Medicare and Medicaid is massive. Not to mention all of the other government entitlement programs.
This results in over 120 trillion dollars of future unfunded liabilities.
Then there’s Quantitative Easing by the government which puts new money into the money supply. This money is printed out of thin air. It is the Governments “Magic Check Book”. Hence, stocks are overvalued.
Have common sense fundamentals gone fuzzy too?
As we look at a 210% increase in the S&P 500, the unanswered questions are, will it keep going up, or will there be a correction, or another devastating crash?
This reality of the S&P 500; my example of 100% return and a 50% loss, is no exaggeration.
Consider where your portfolio is sitting today. Are you at risk?
Do you have certainty and predictability in your portfolio?
The next time you see a TV commercial or financial adviser promoting financial advice using the word “average”, it should be an immediate red flag for you.
Average is meaningless.
And…in addition to this, you still have to consider what the impact of taxes and fees will have on your portfolio.
At the end of the day, what does it mean to you? That bottom line is an “actual” return.
Get to the bottom line and discover what is really going on in your portfolio.
Sincerely,
Barry Brooksby